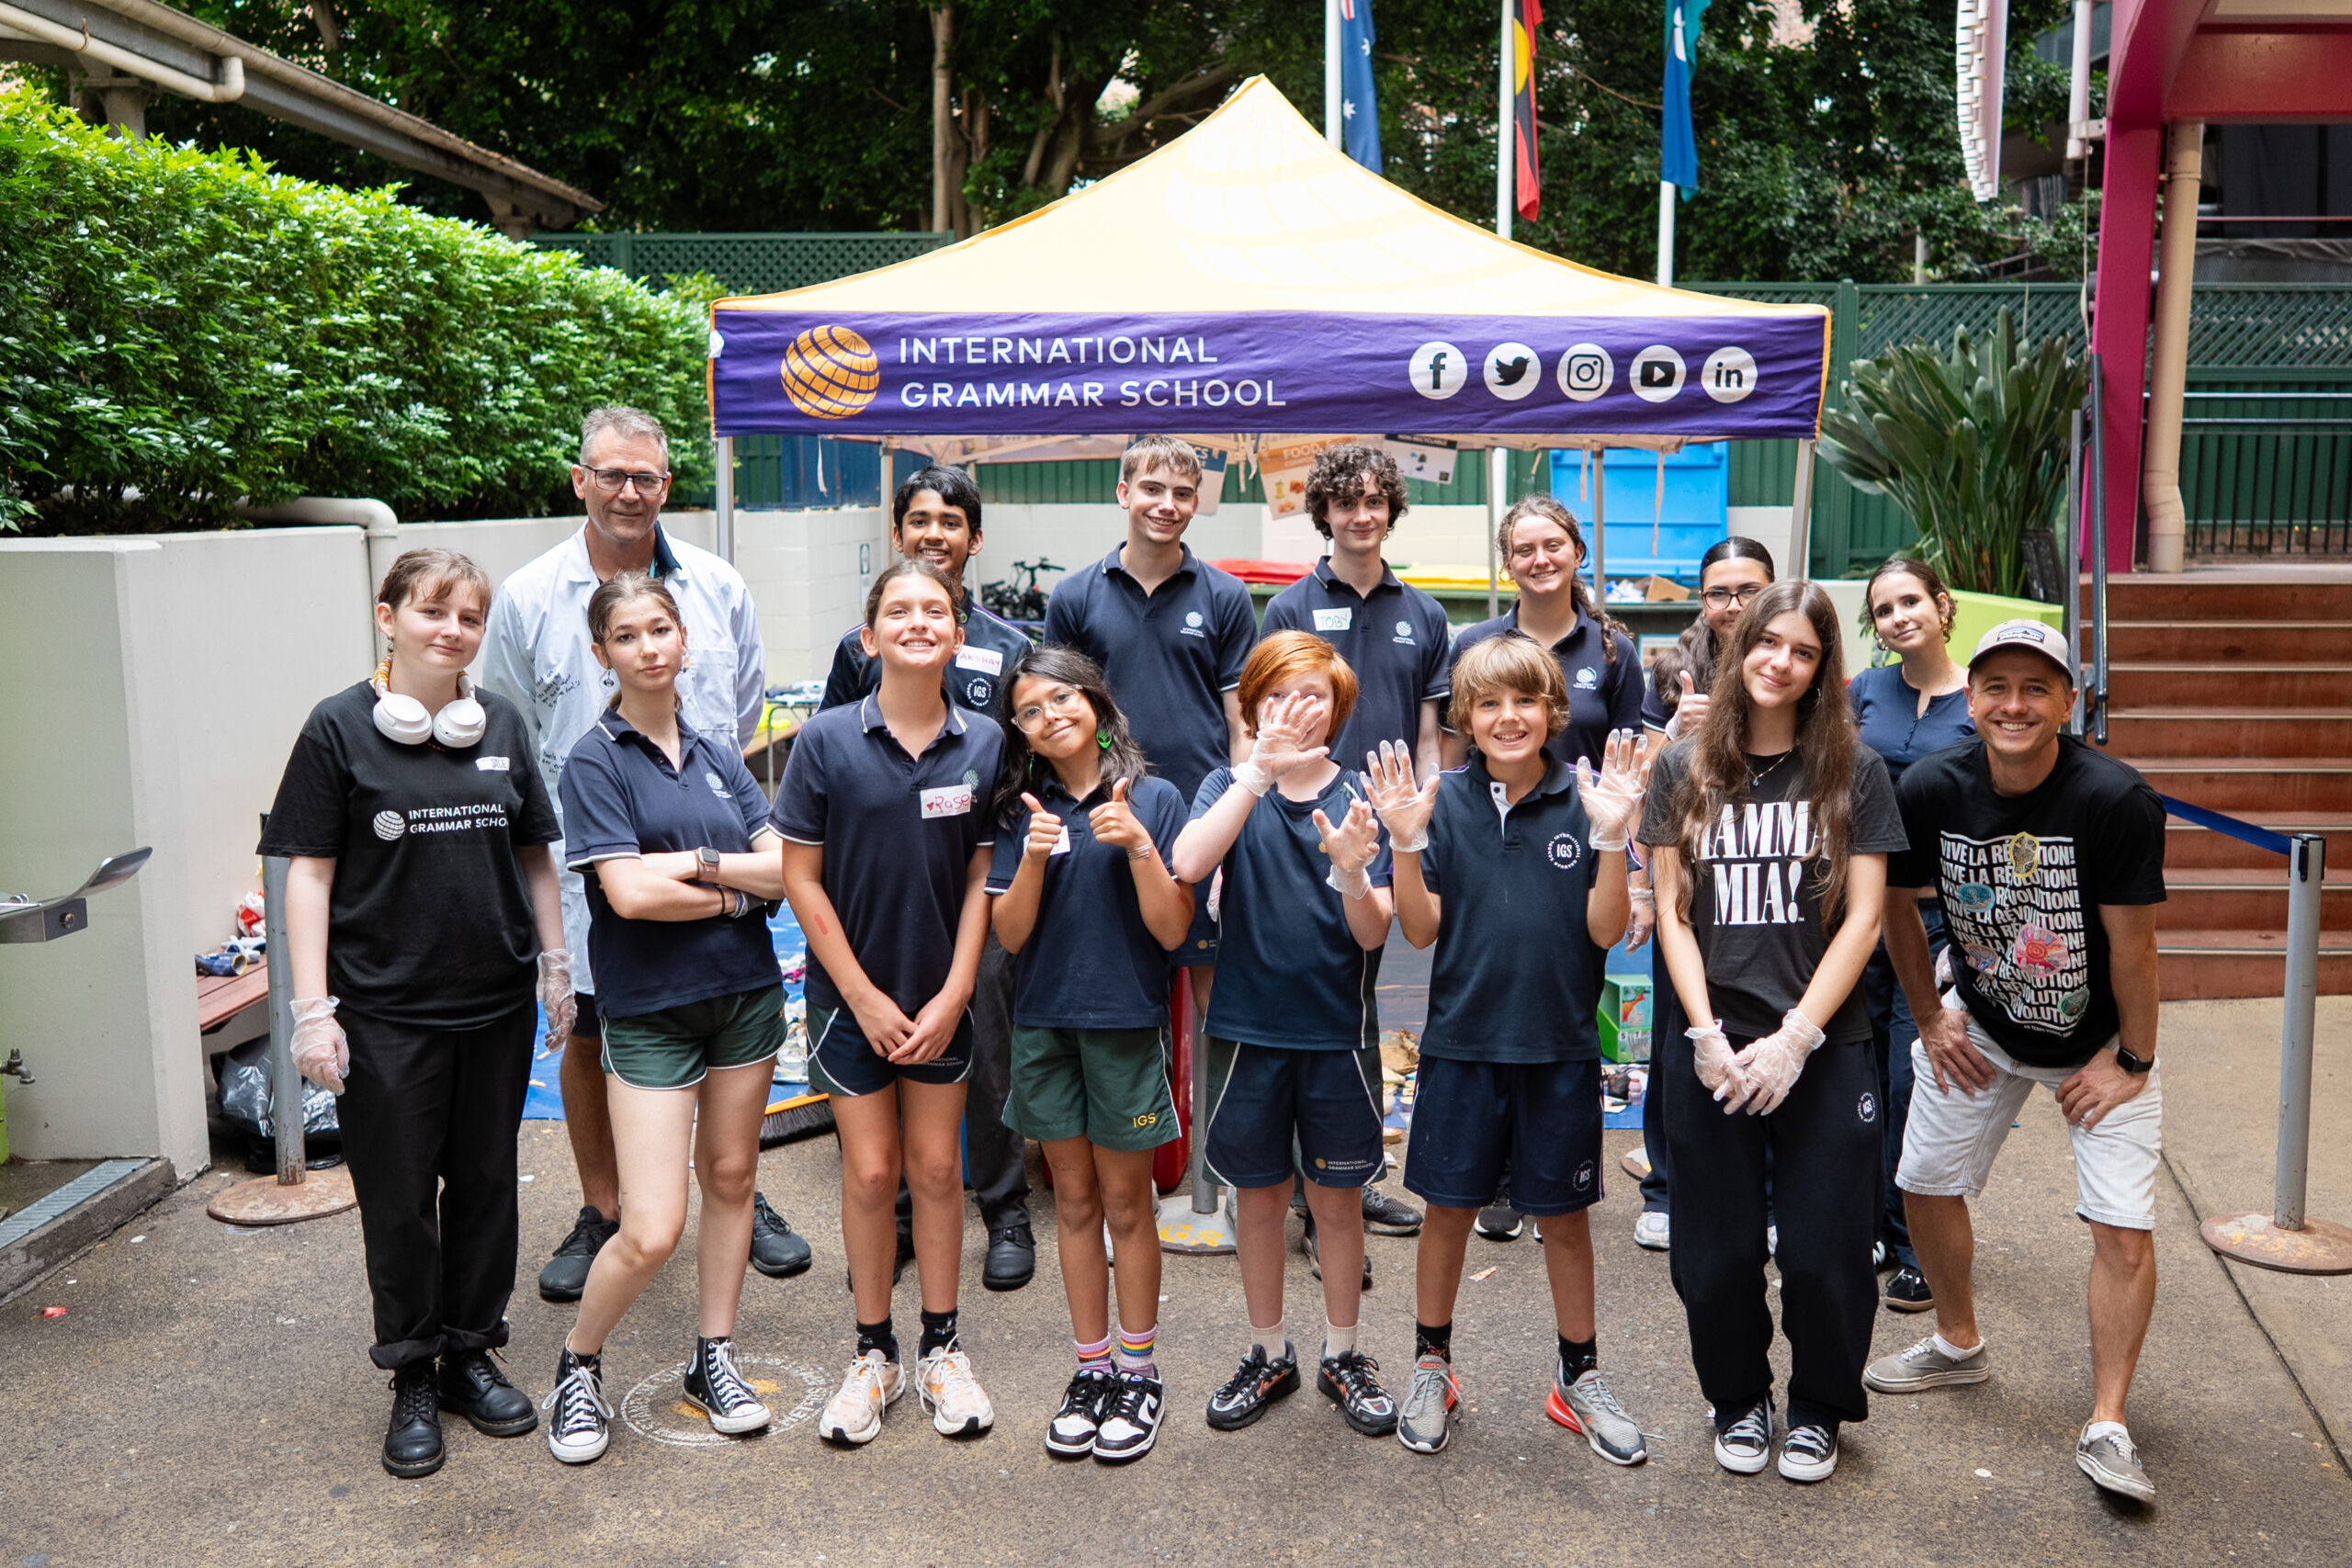
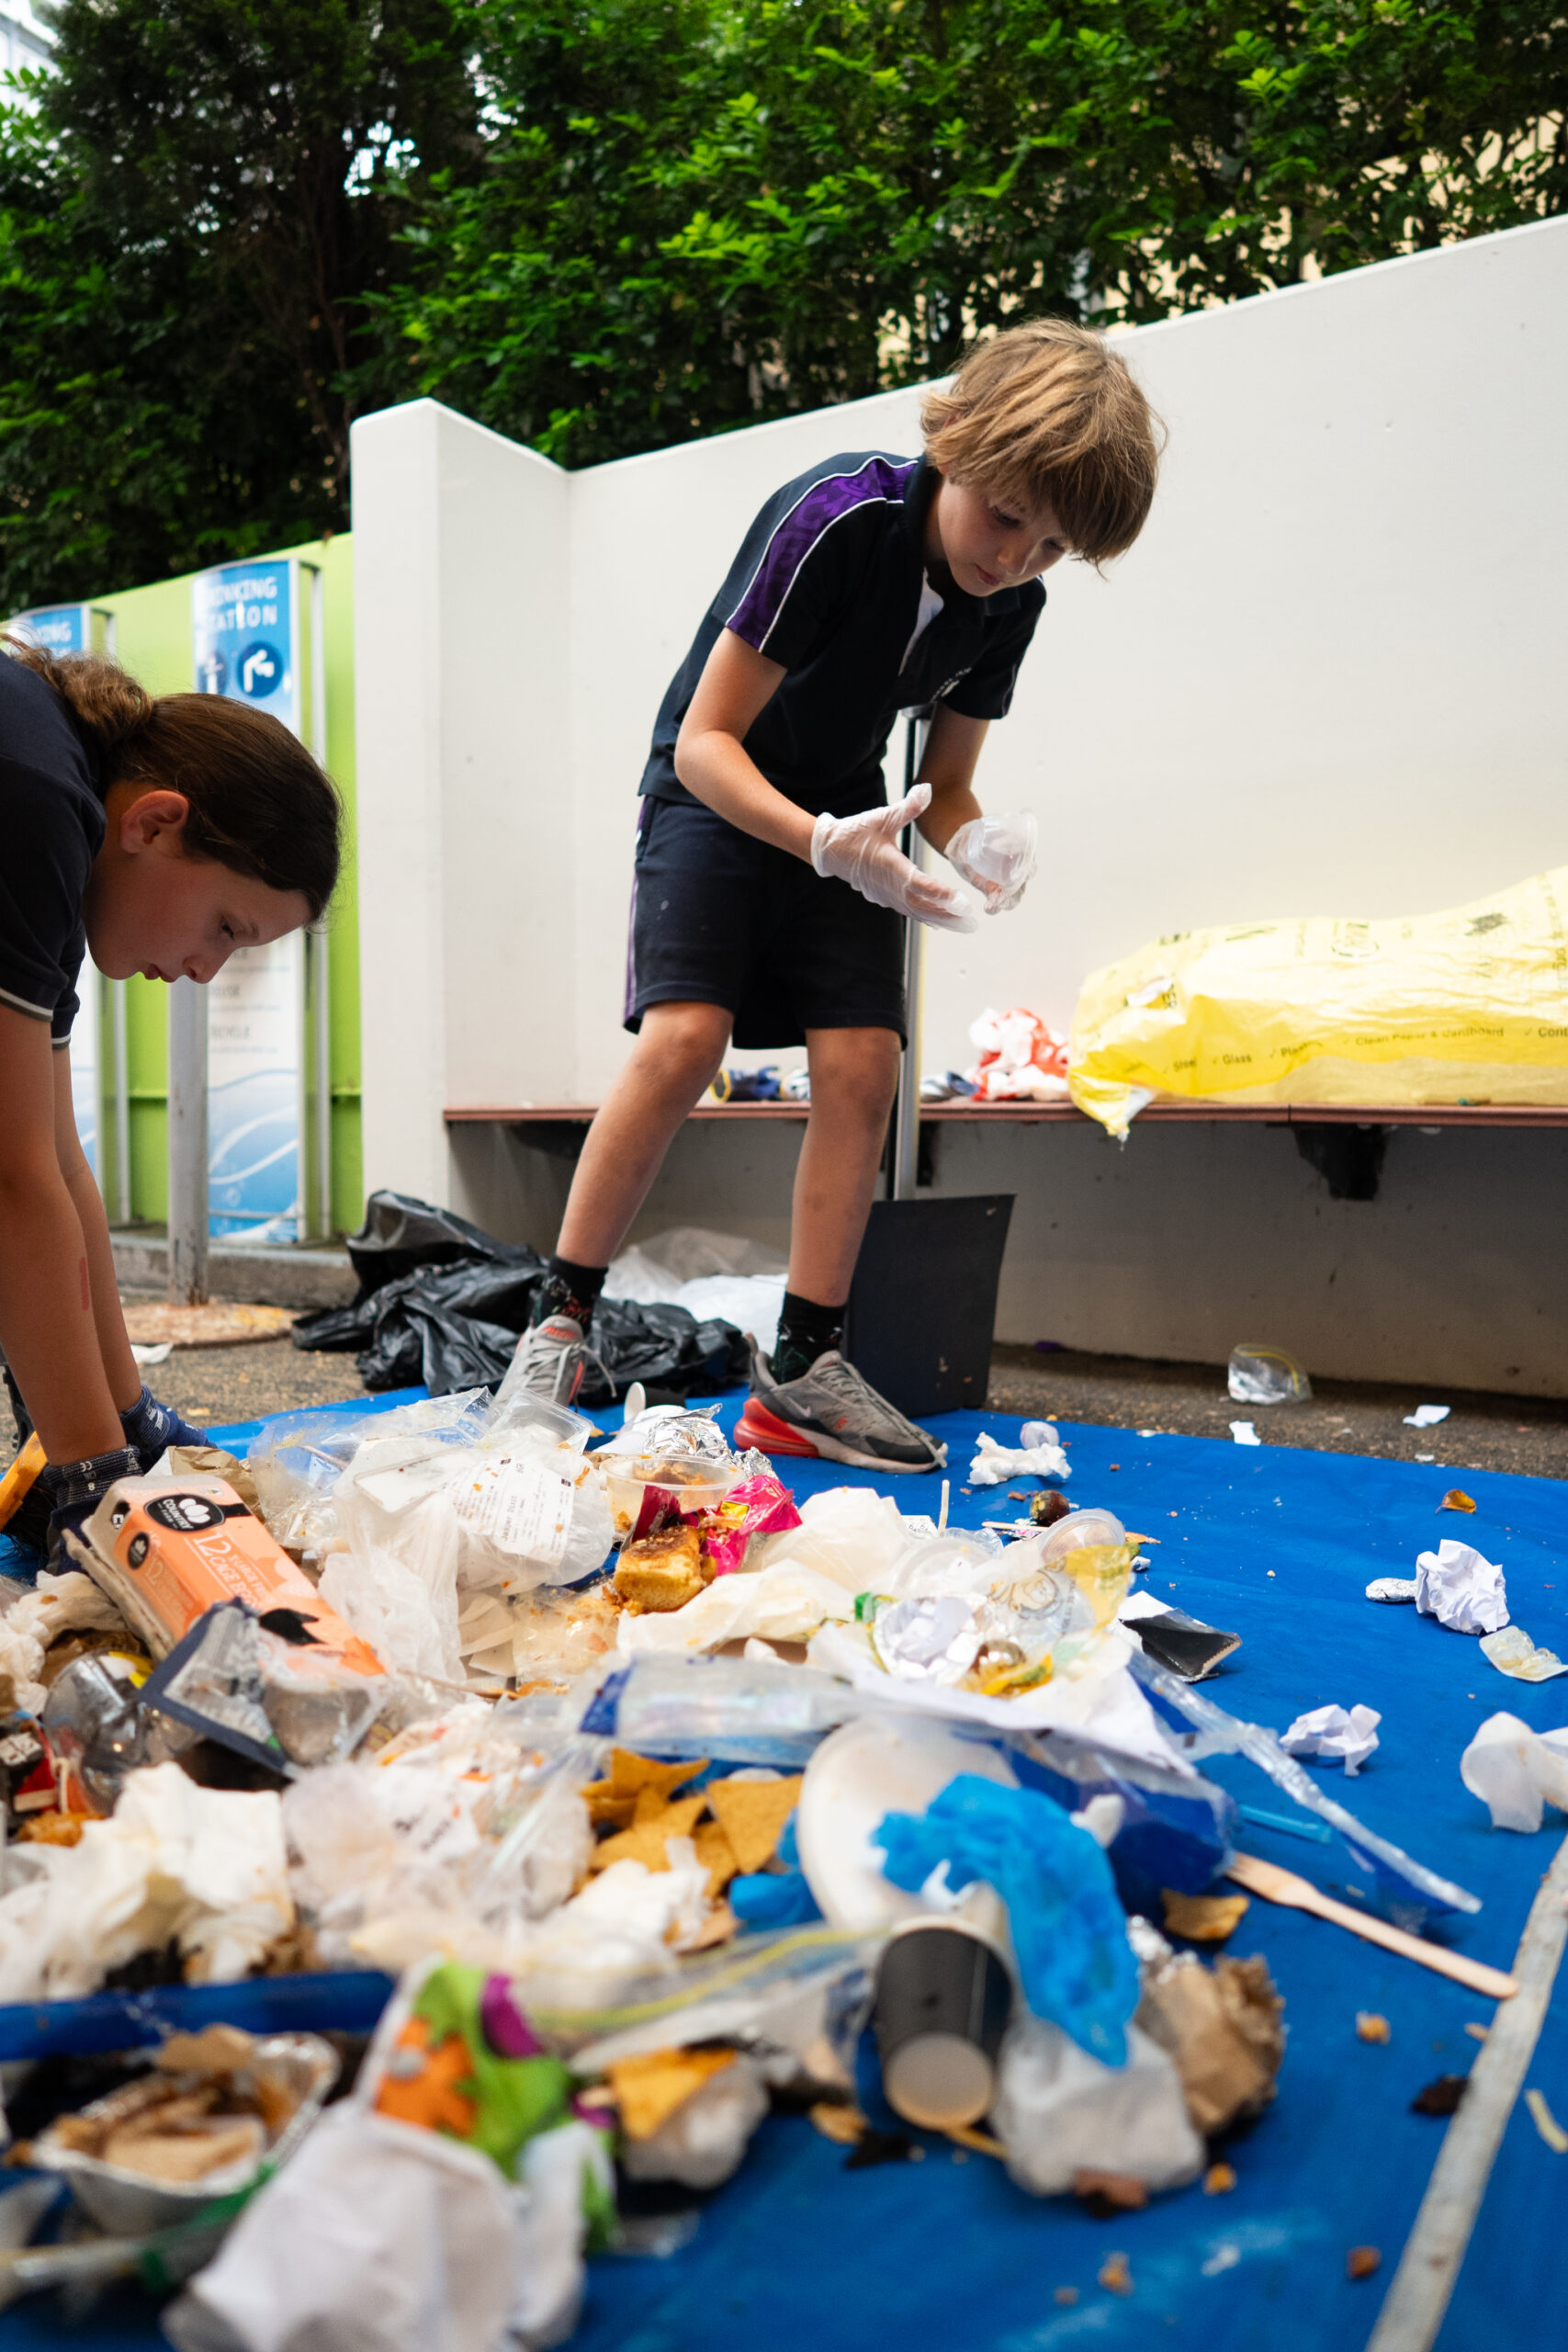
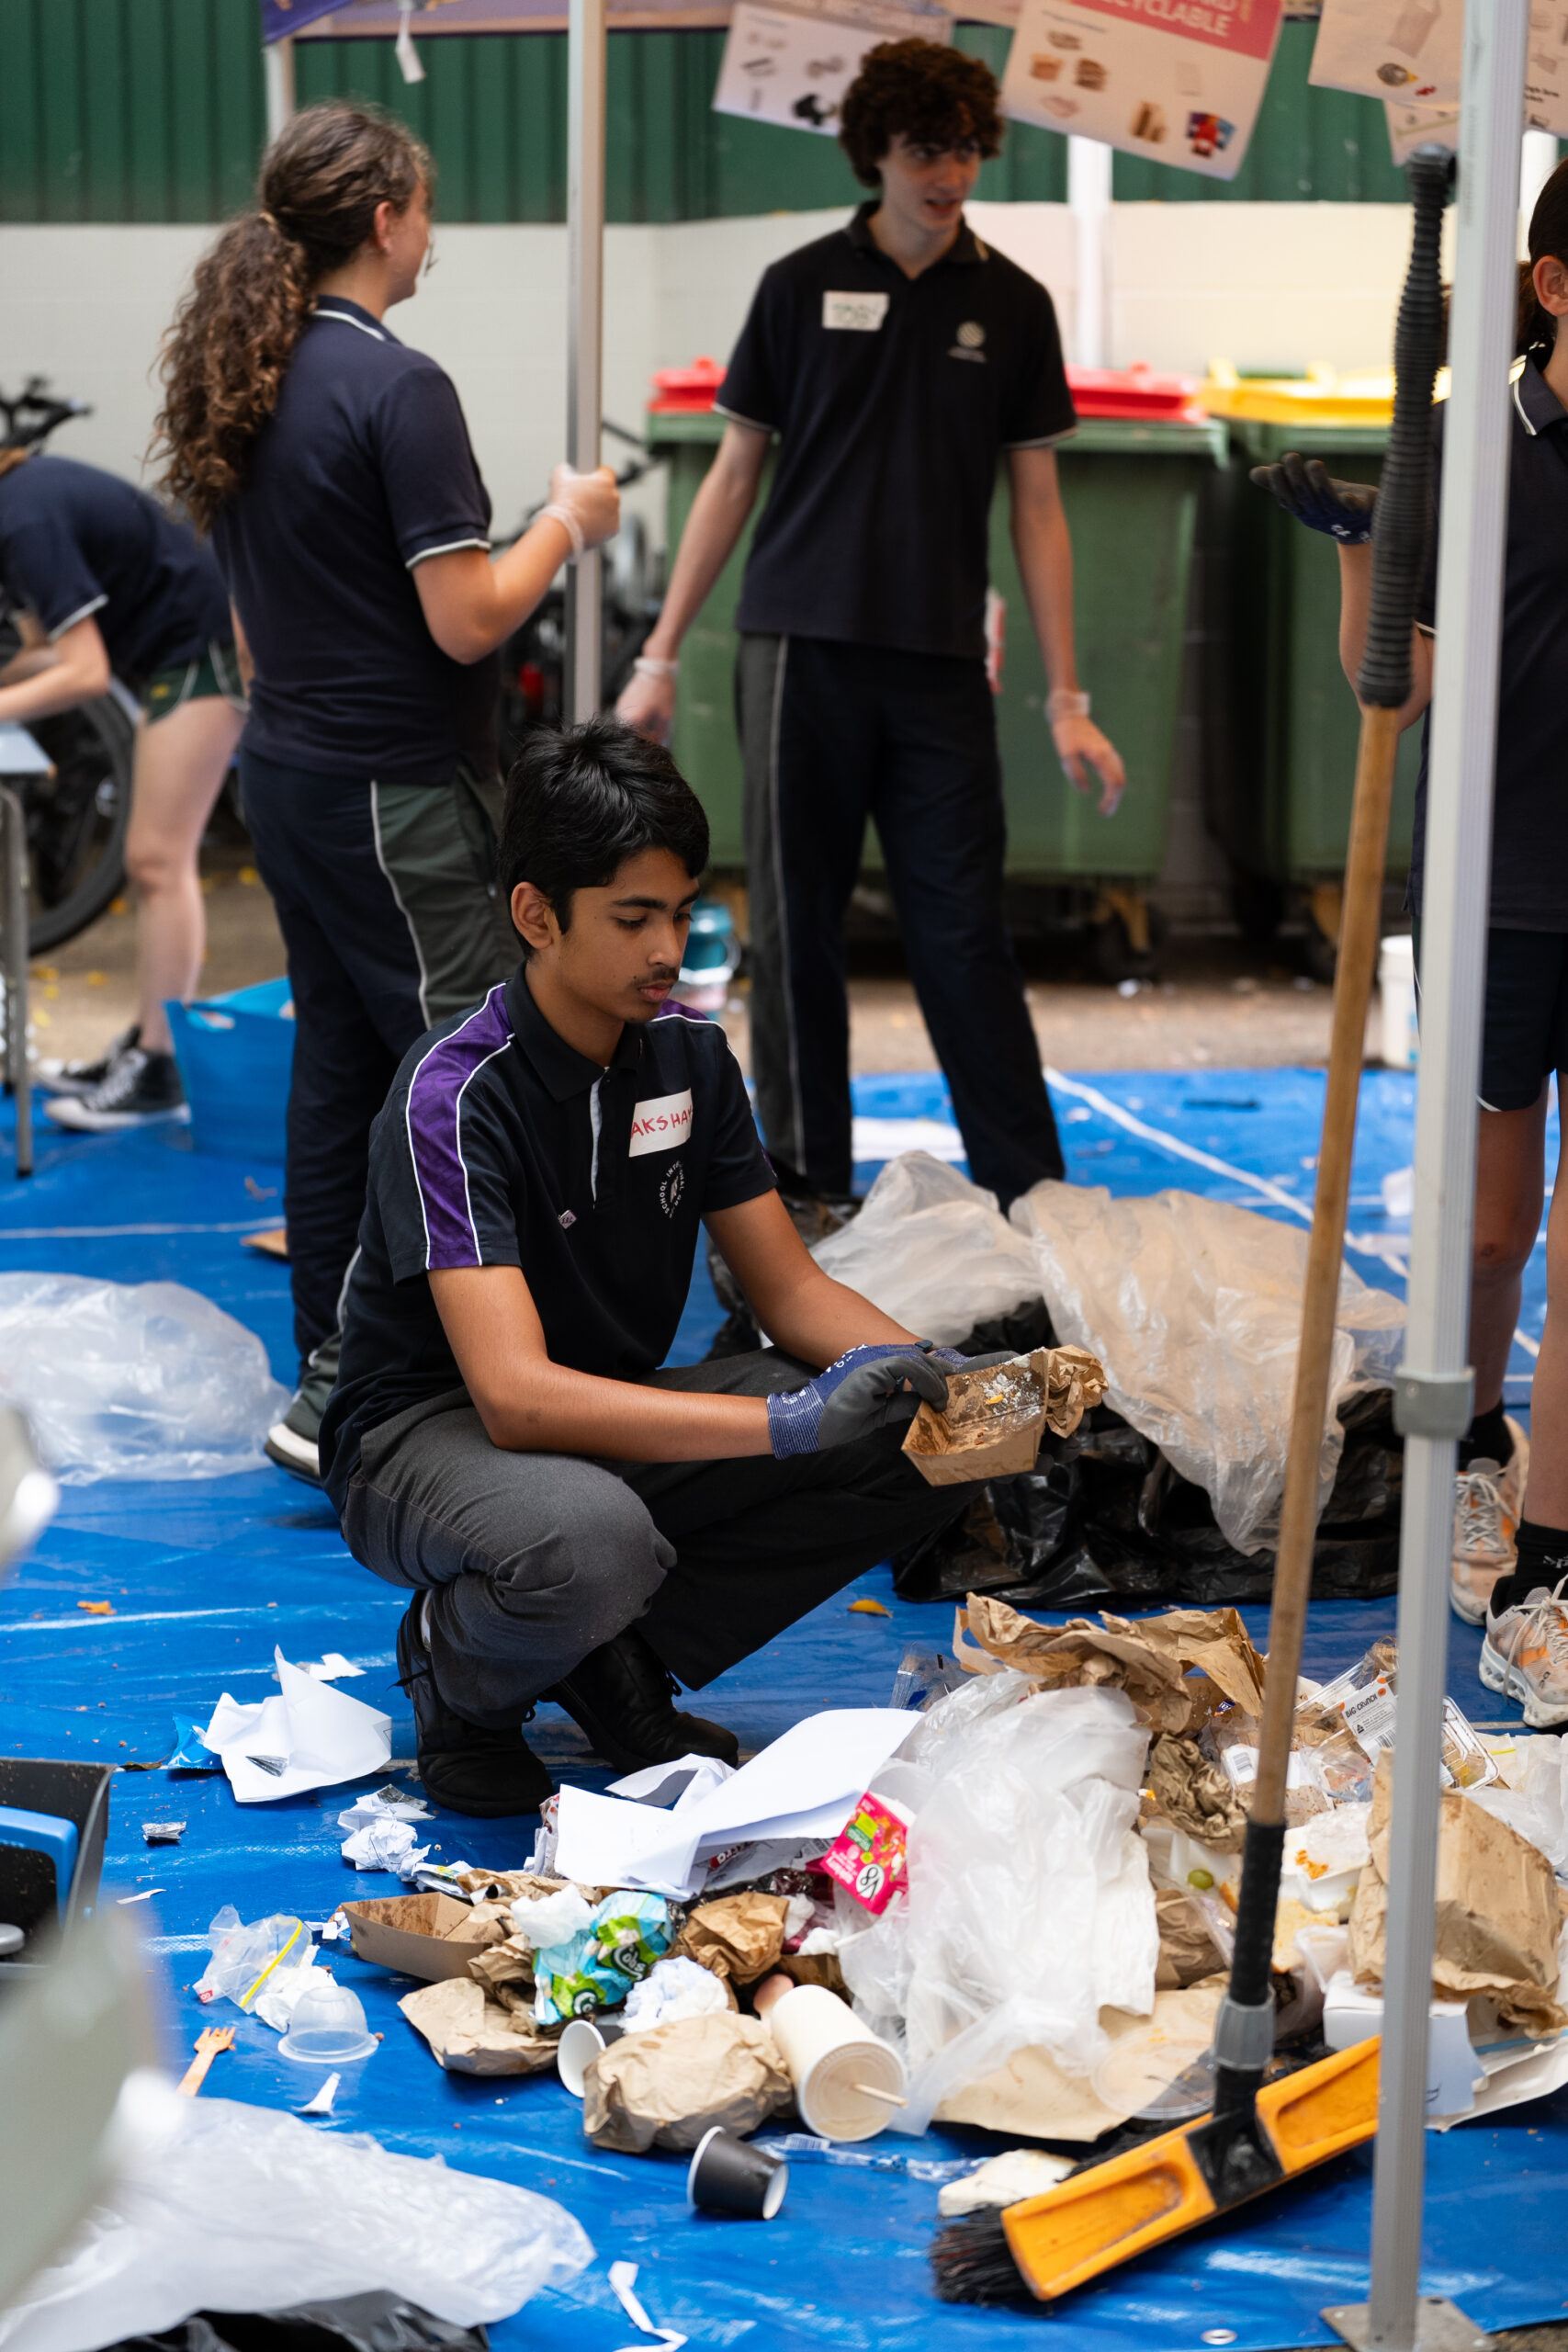
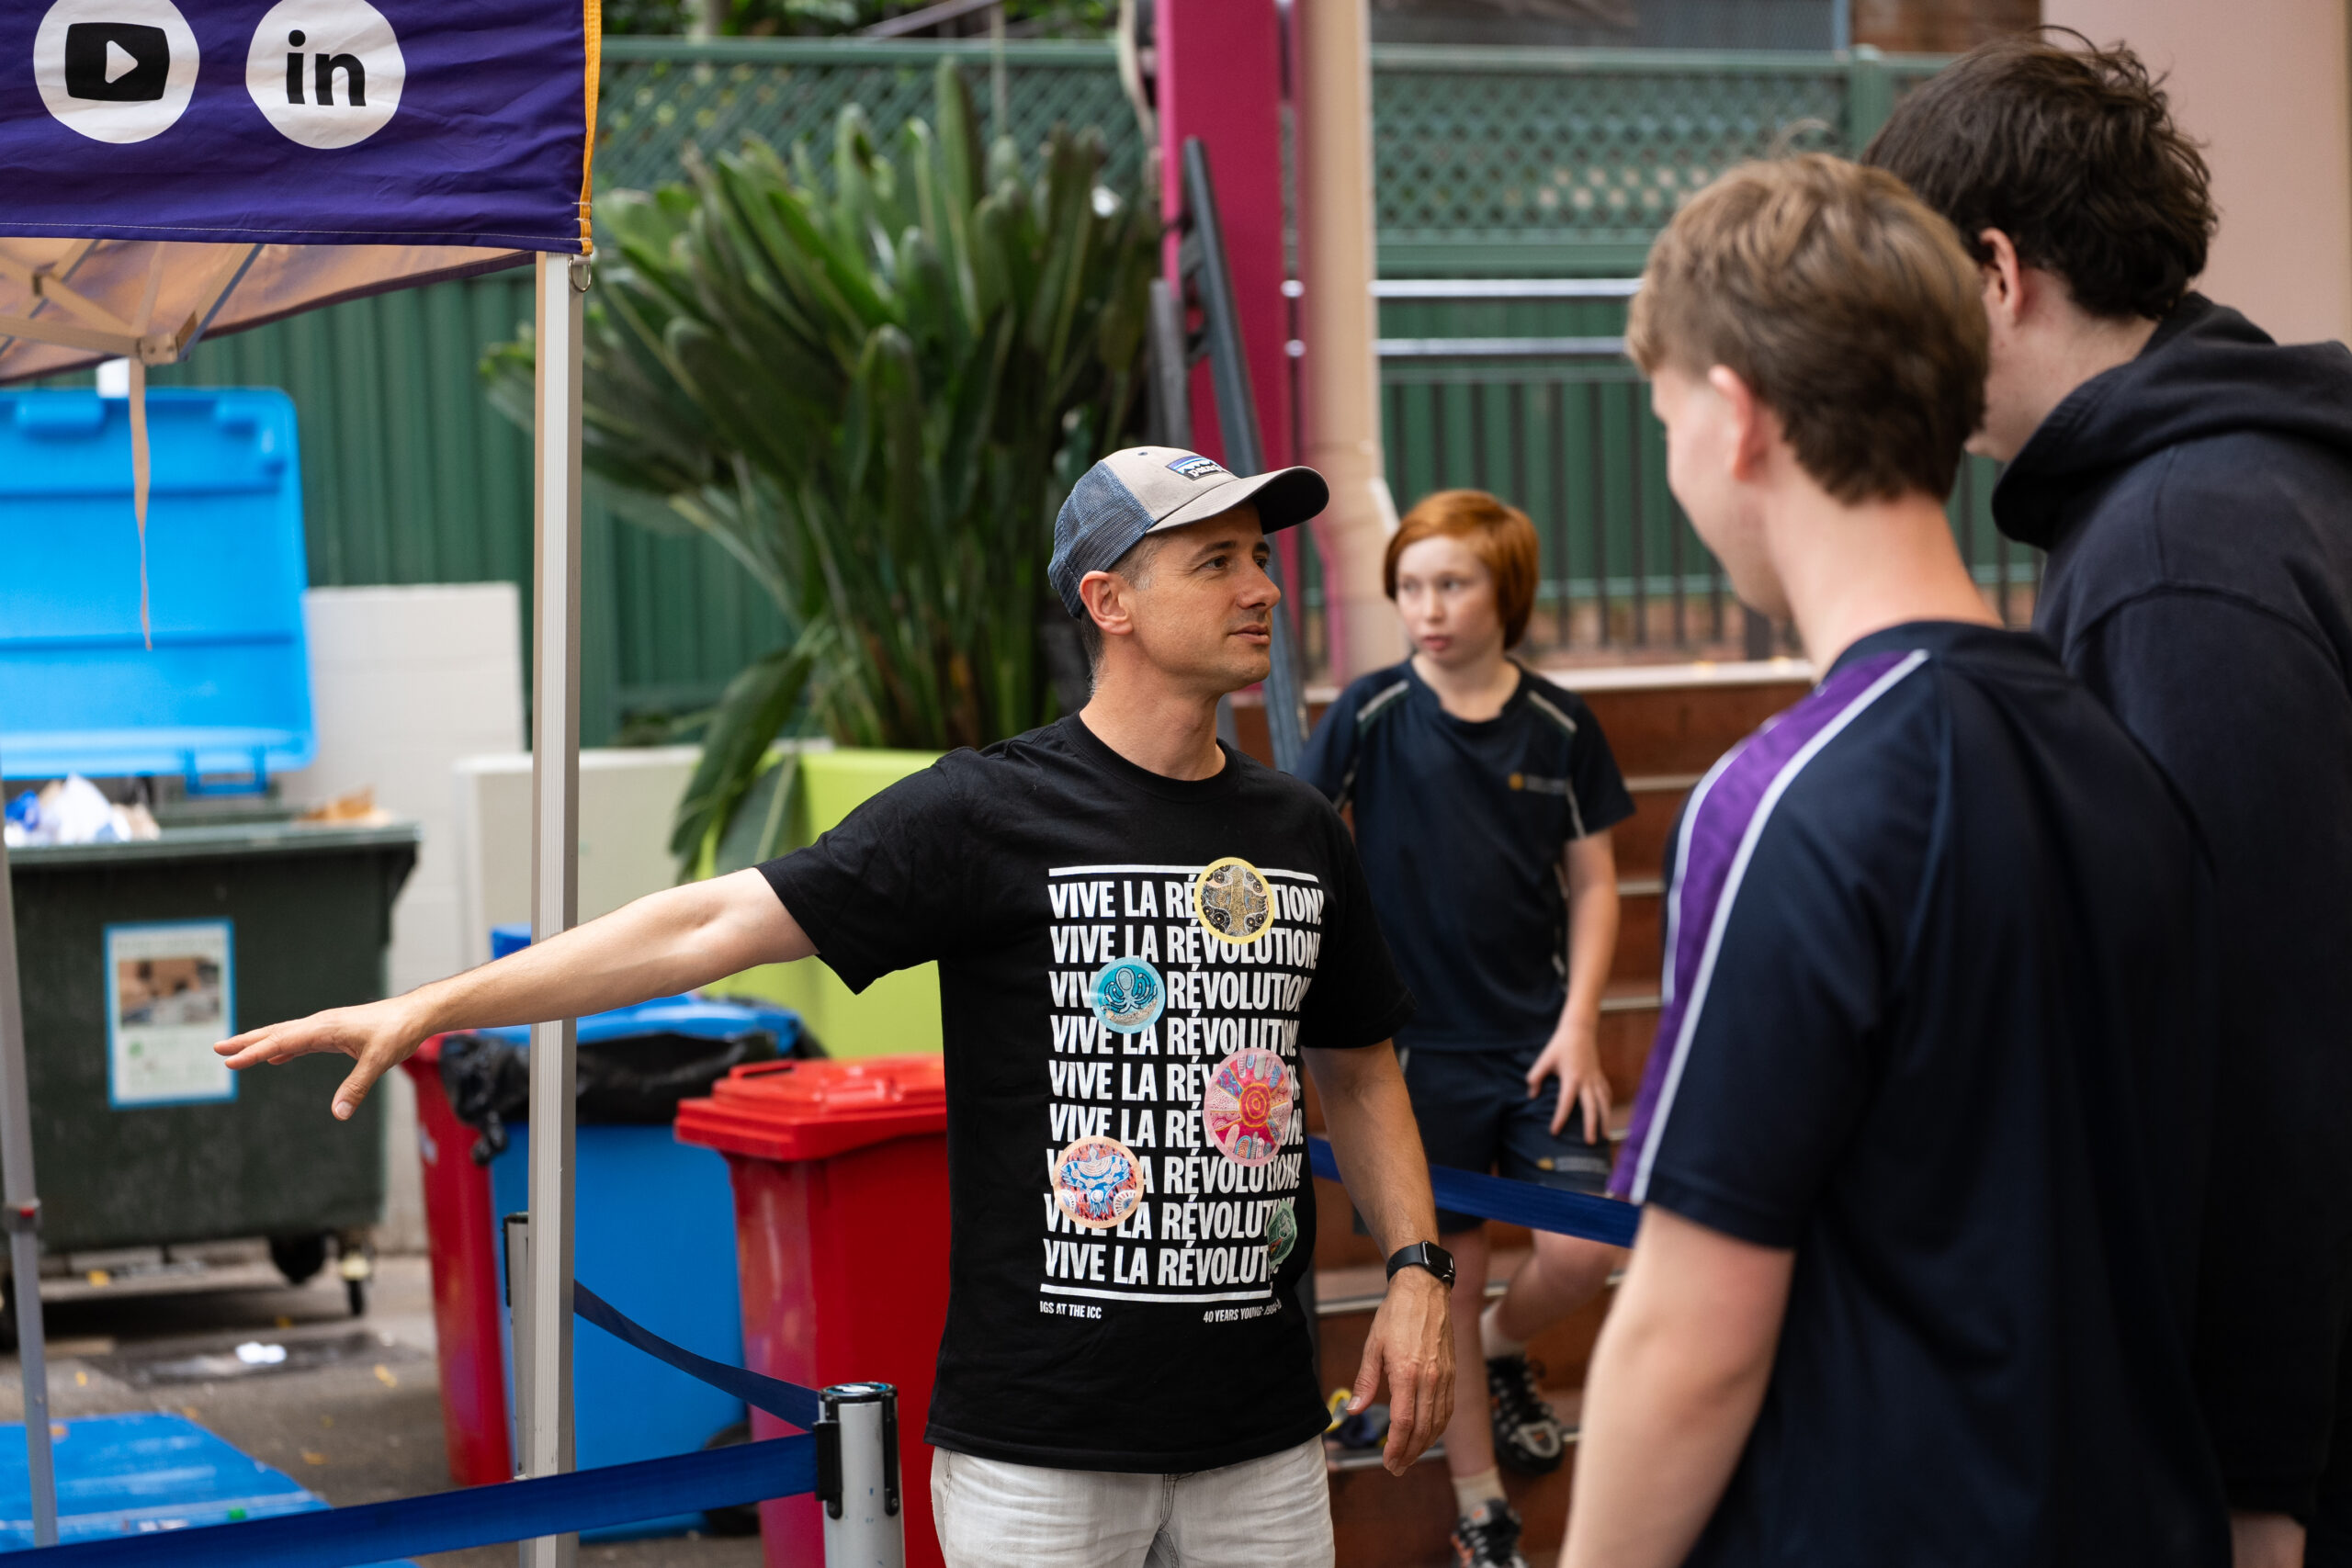
IGS Sustainable Futures students completed our fourth waste audit on Thursday 19 March. They collected, sorted, measured and recorded data on the waste we generate. By analysing this information, they aim to gain deeper insights into the origins, categories and destinations of IGS’s waste.
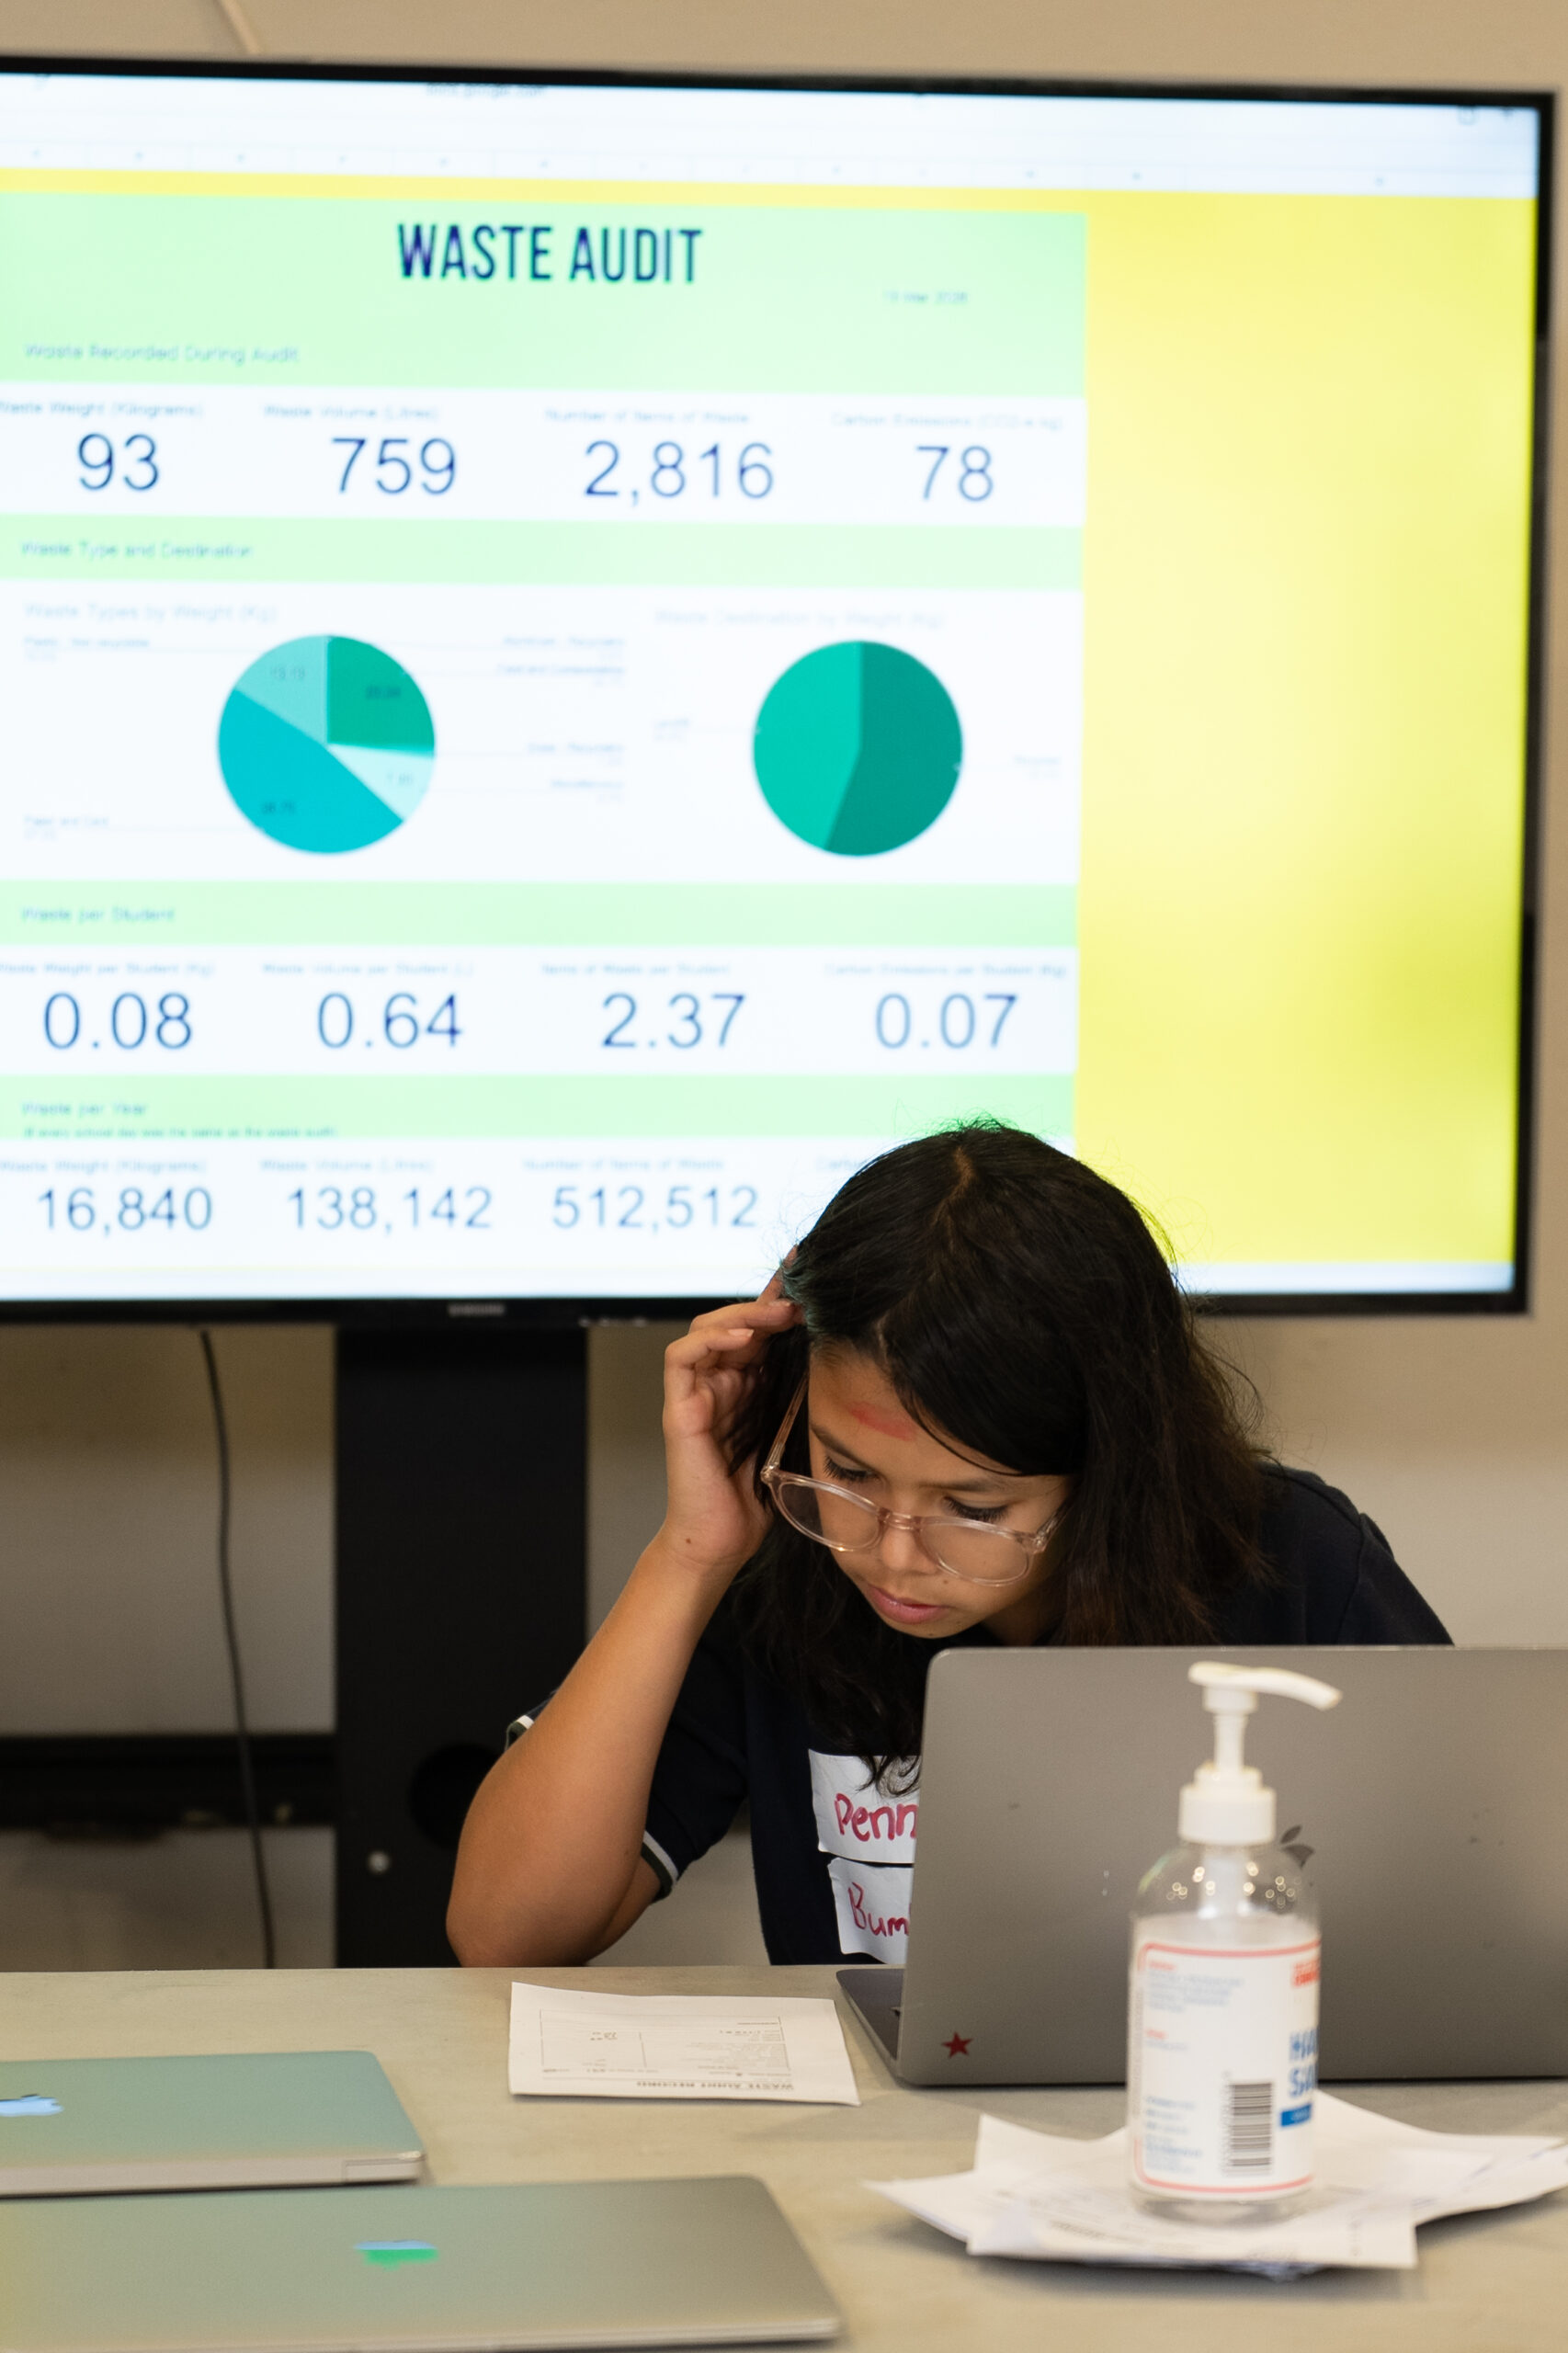
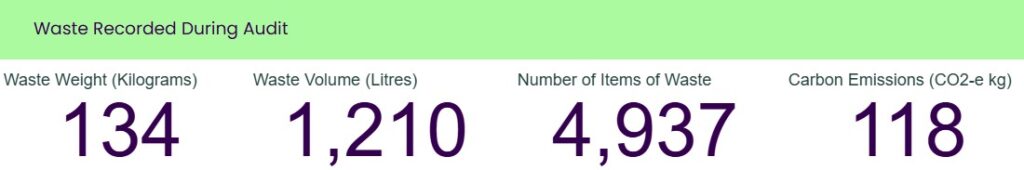
Students collected 134 kg of waste, a total of 4,937 items.
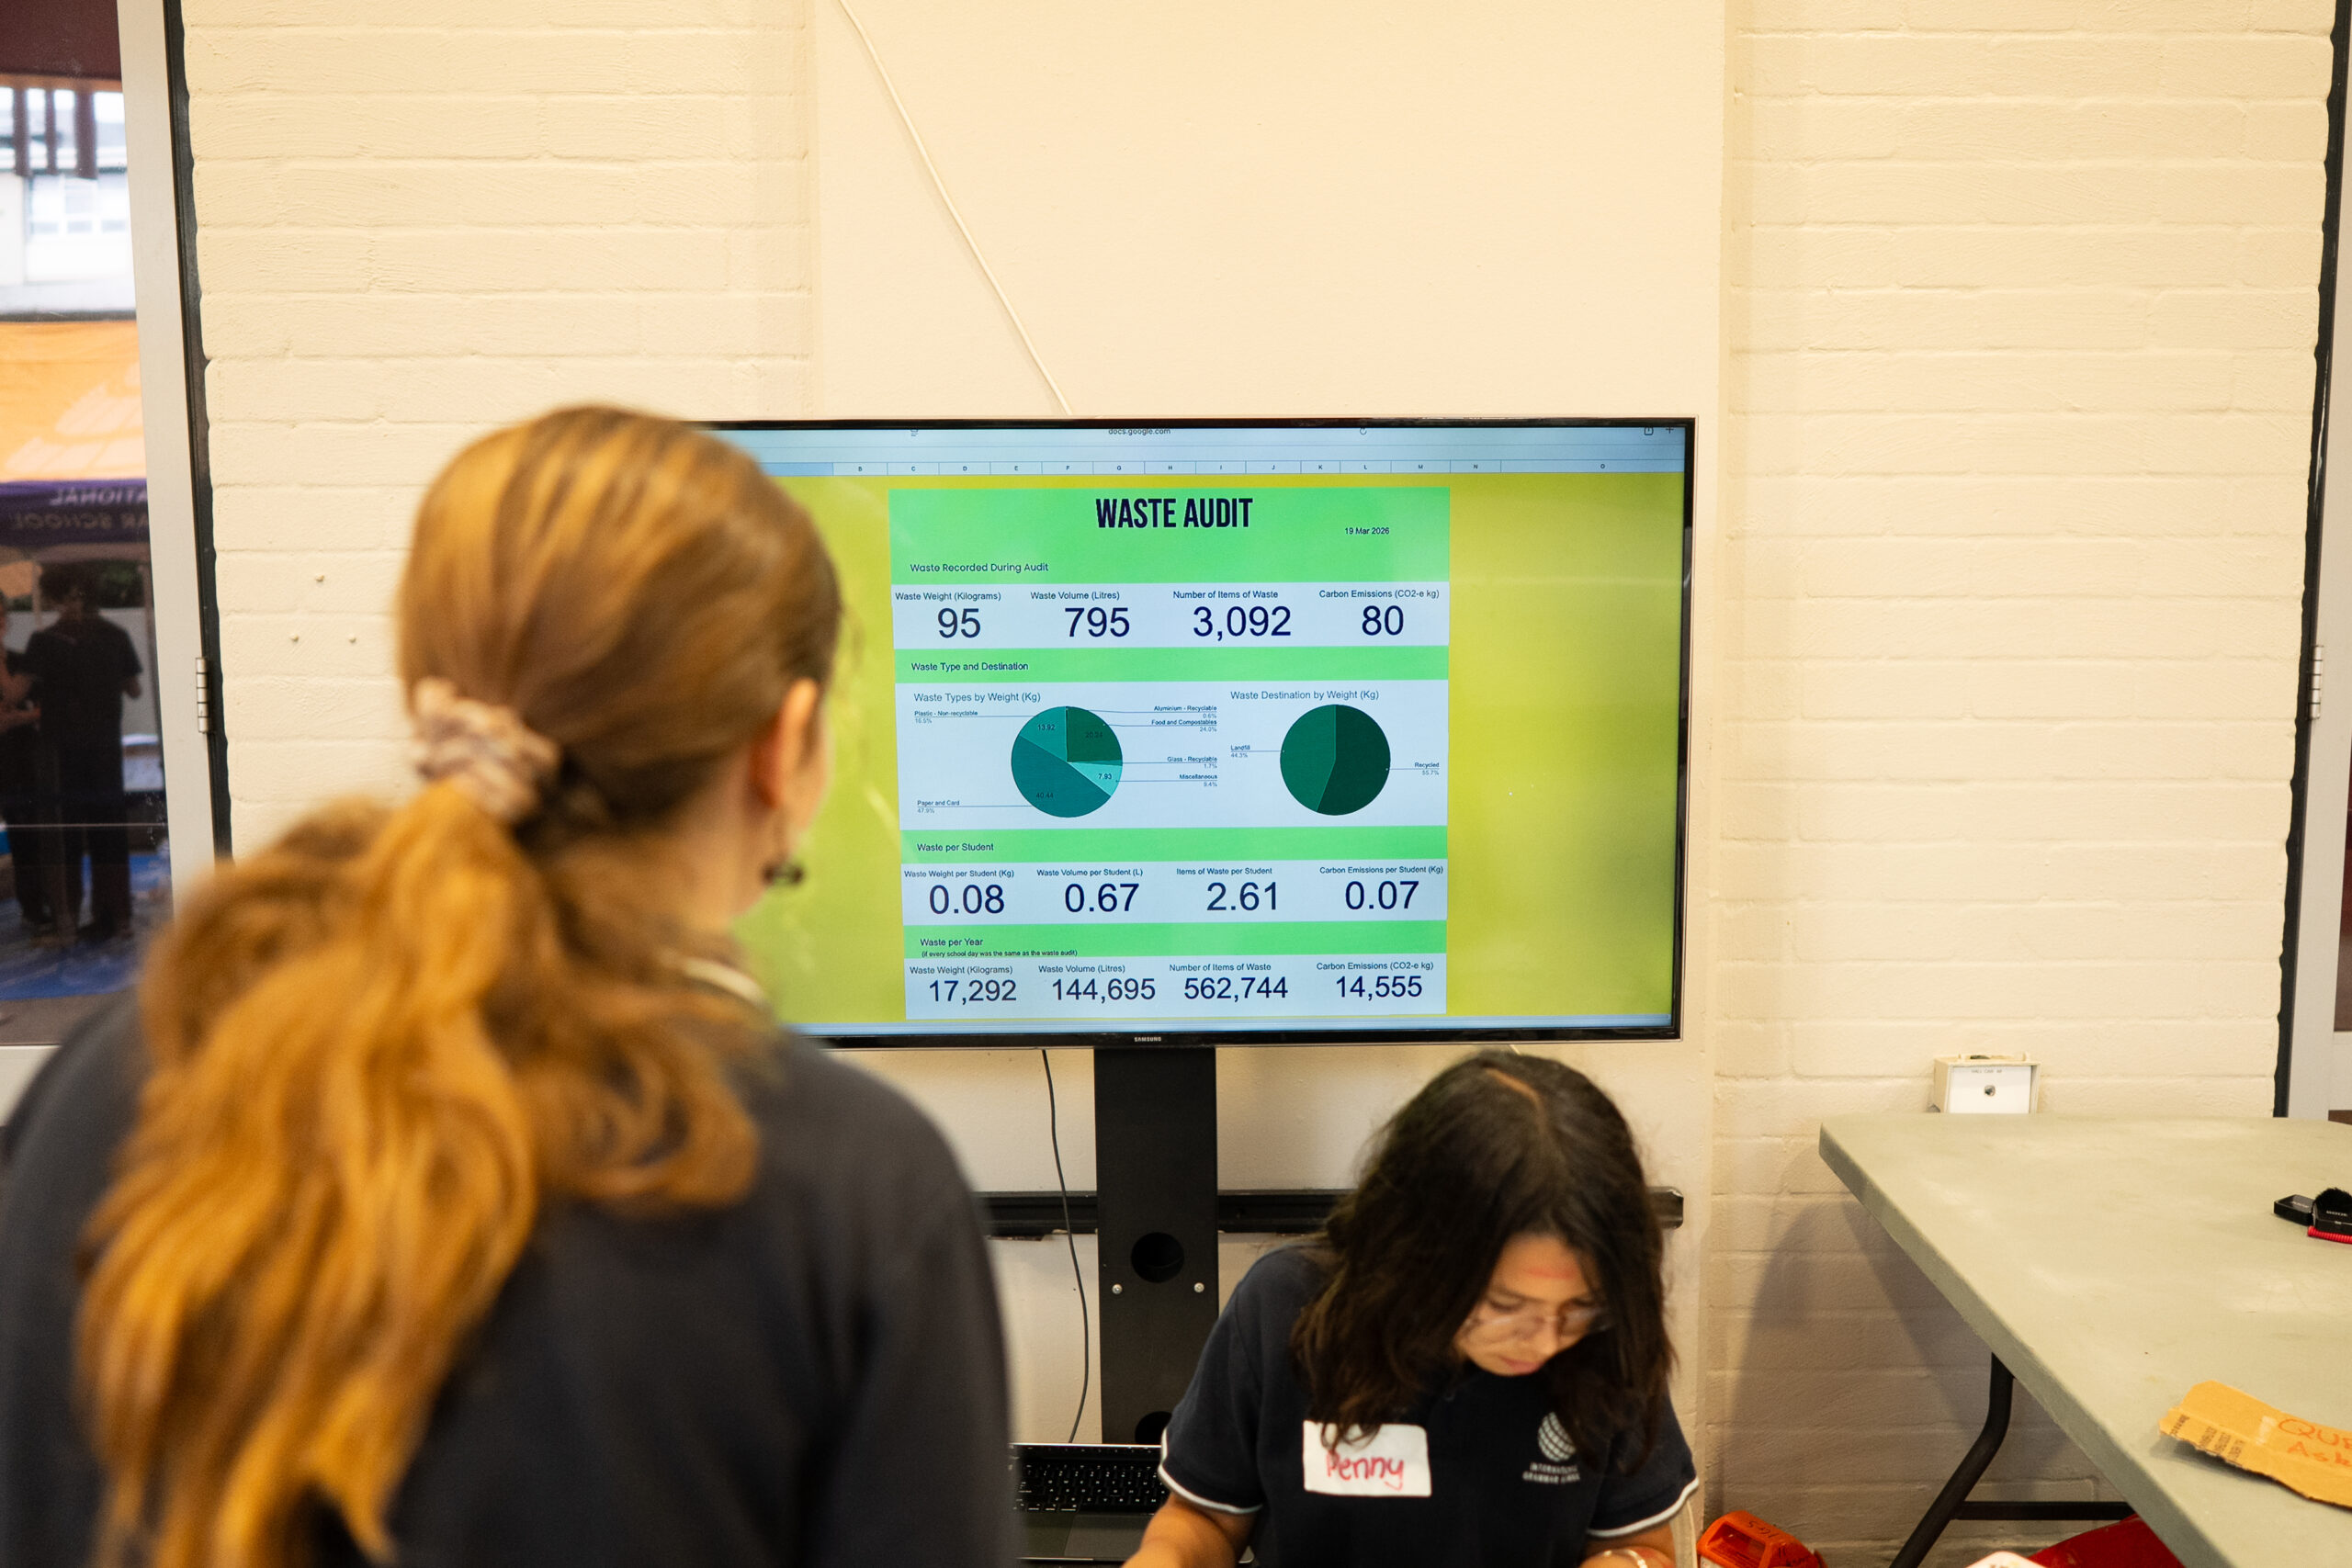
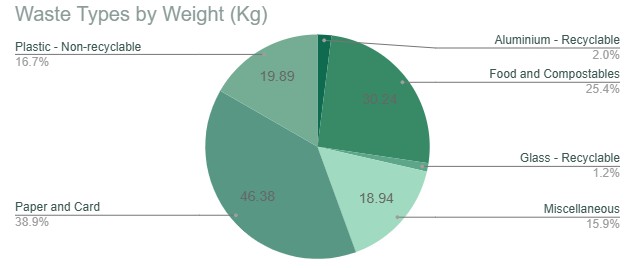
The largest segment of waste found was paper and card (39%), followed by food and compostables (25%) and non-recyclable plastic (17%).
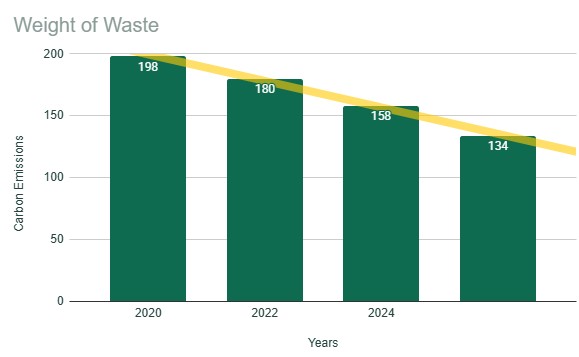
The good news is that IGS is producing less waste by weight. The weight of waste they measured decreased from previous years. Weight reduced from 198kg in 2020, 180kg in 2022, 158kg in 2024, and 134kg in 2026, representing a decrease of 32%.
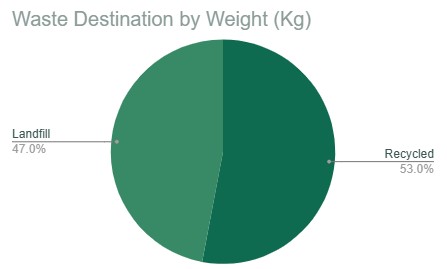
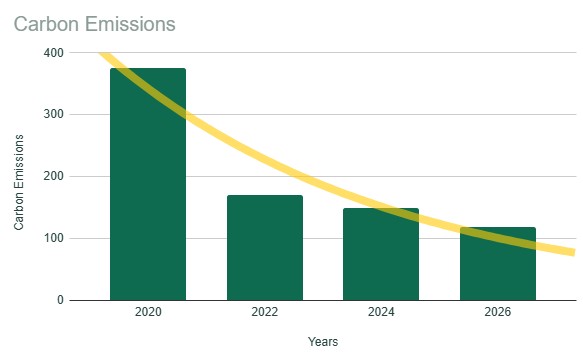
According to their analysis, we have improved our level of recycling. The amount of waste recycled increased from 19% in 2020 to 50% in 2022, 50% in 2024 and 53% in 2026. And we are emitting less carbon from our waste because of our recycling improvements. The amount of carbon emissions decreased from 375kg CO2-e in 2020 to 170kg CO2-e in 2022 then to 149kg CO2-e in 2024 and 118kg CO2-e in 2026.
These findings highlight the positive impact of ongoing sustainability efforts across the school community. Sustainable Futures students will present this information to students at the High School assembly.
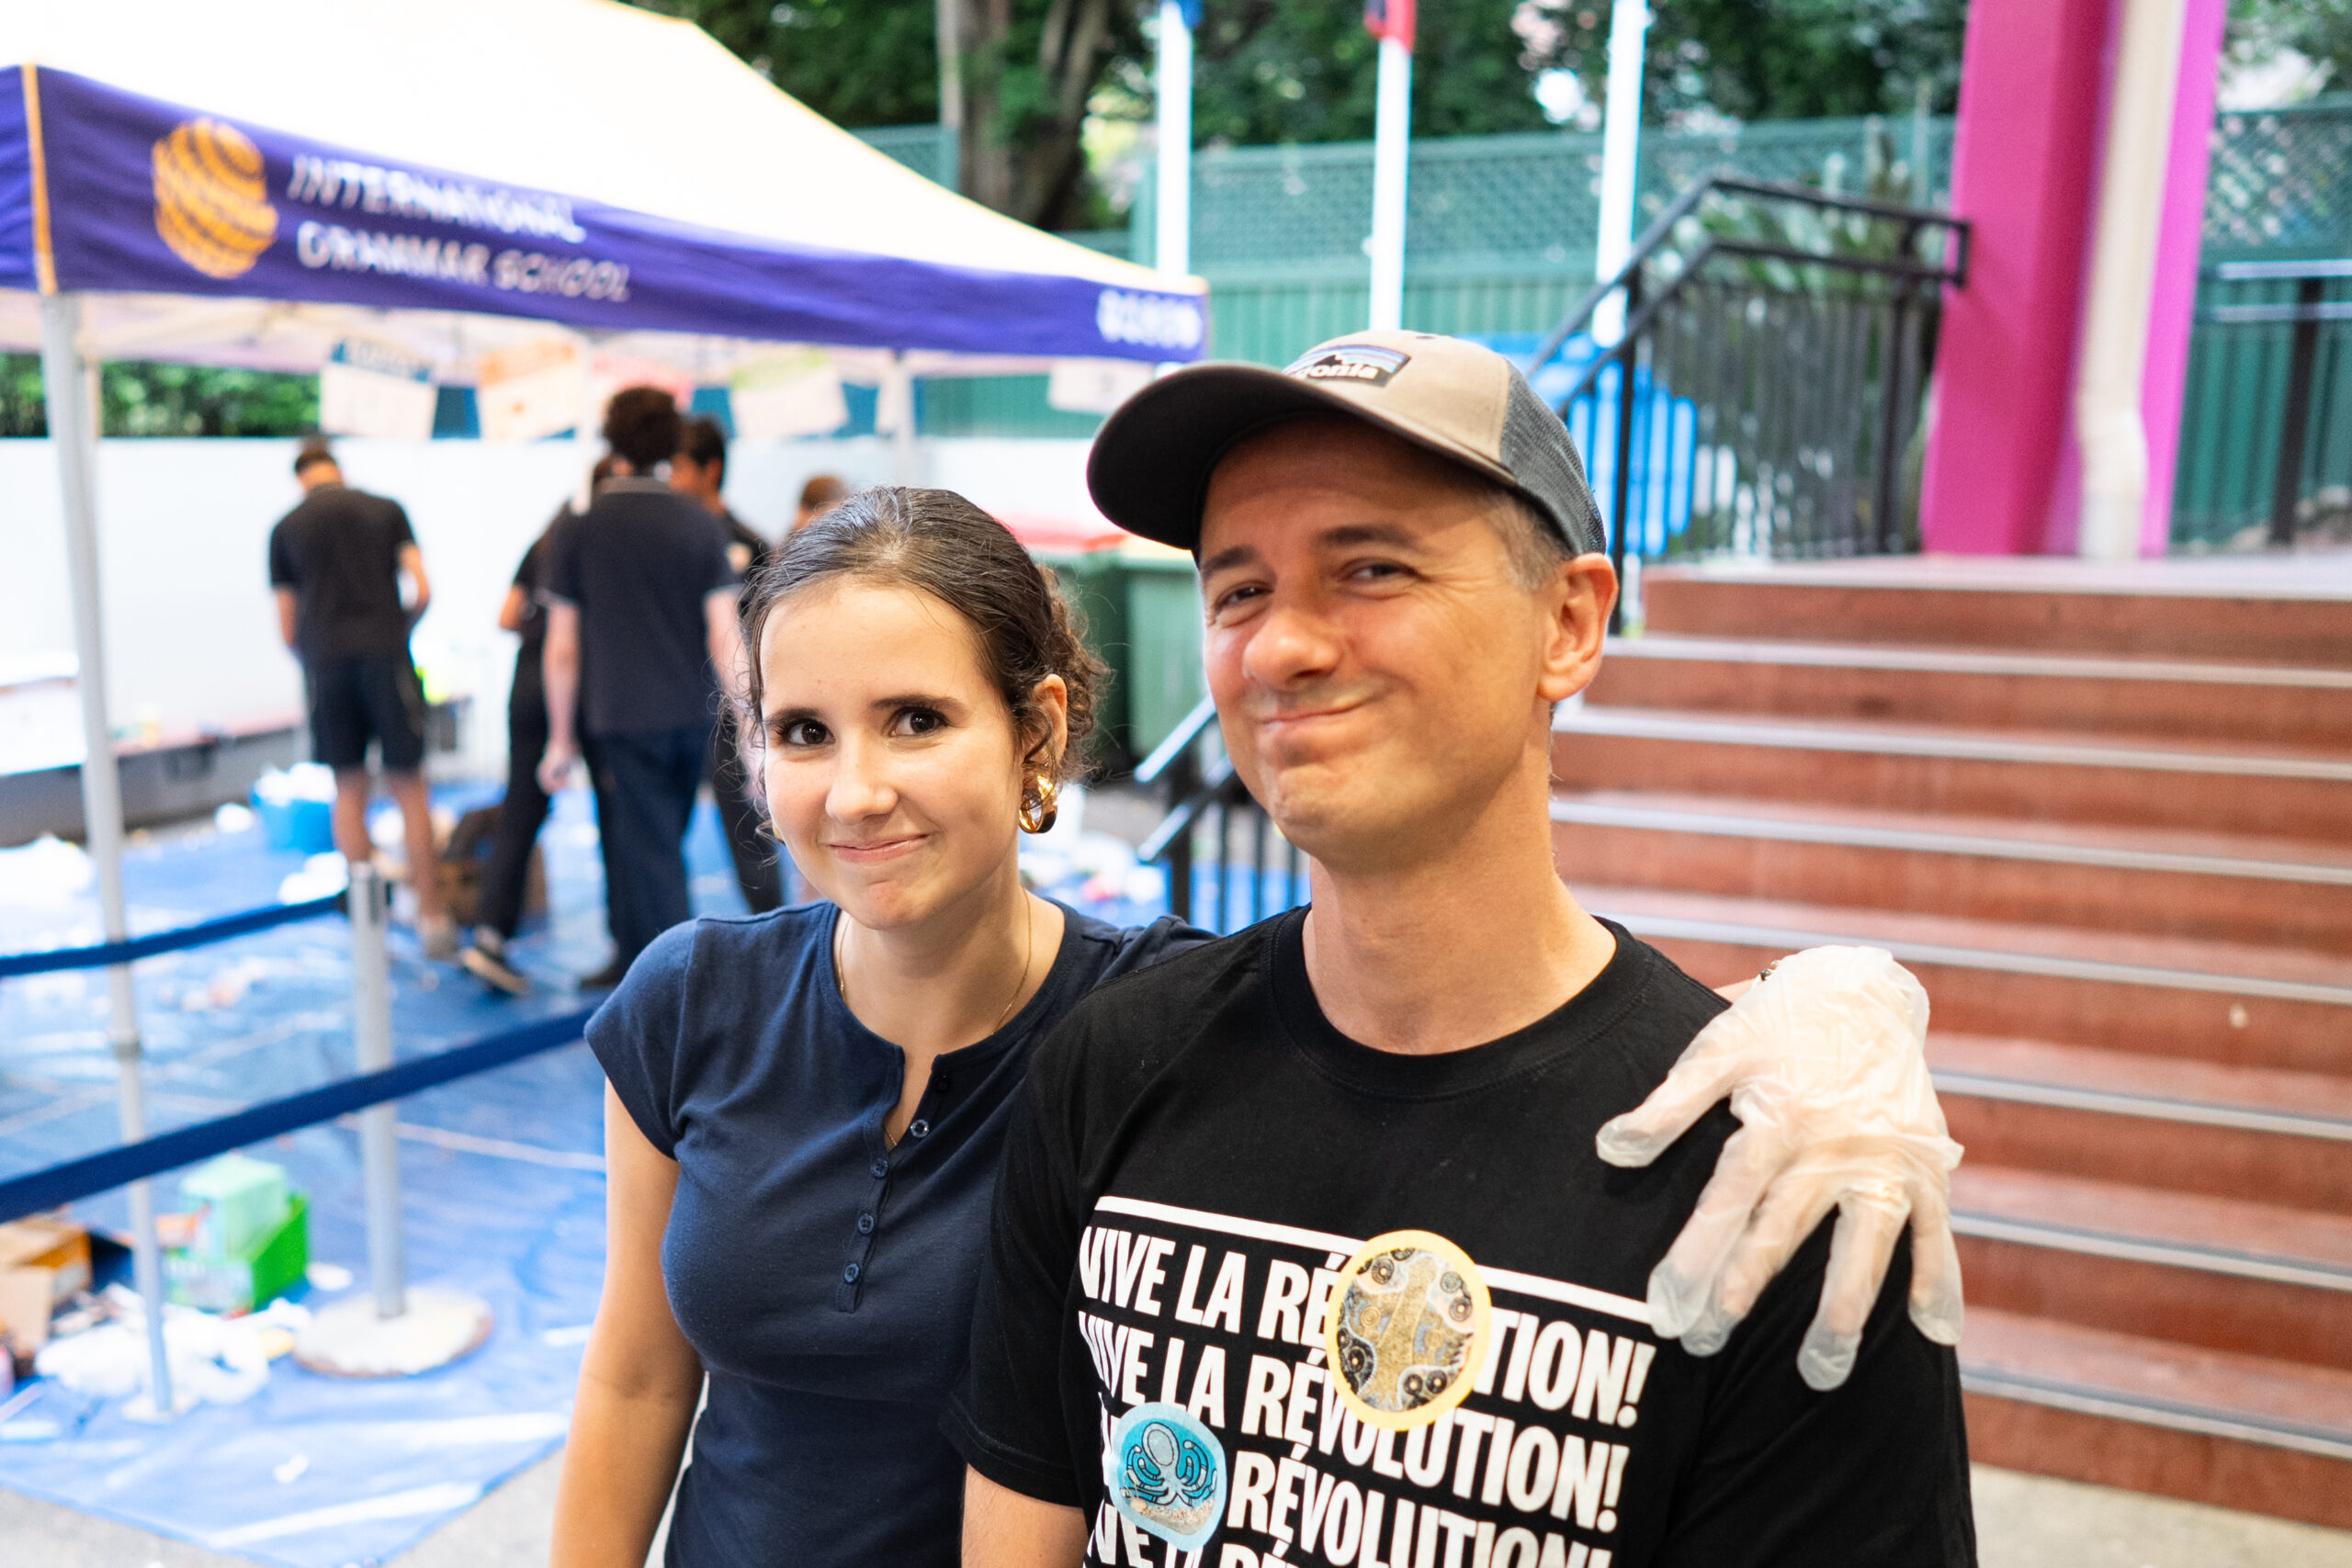
Thank you to all students involved and Carmelo Fedele Head of Sustainability for leading the audit.